
Loading

This release introduces a significant redesign of the dashboard.
Now the system operator can choose a time period and the information for the desired period will be displayed on the dashboard:
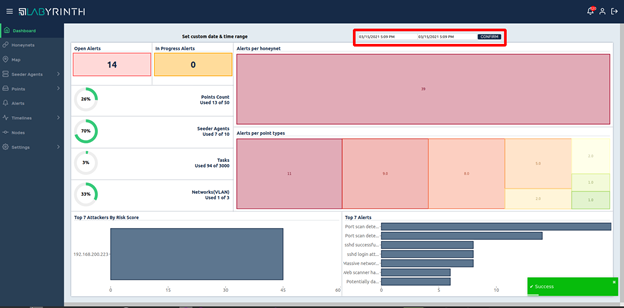
On the upper left of the dashboard, the number of new alerts and alerts that have already been processed by the system operators is displayed:/p>

Now the operator can quickly receive information not only on the number of active components of the system, but also on the use of license limits:

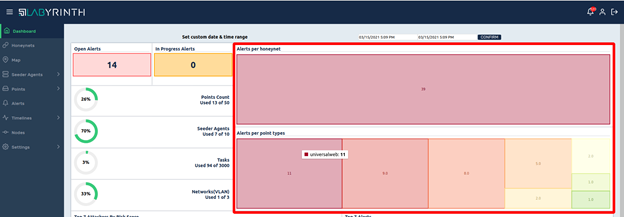
On the right side, the distribution of alerts by Honeynets and by types of Points, where they occured, is displayed:
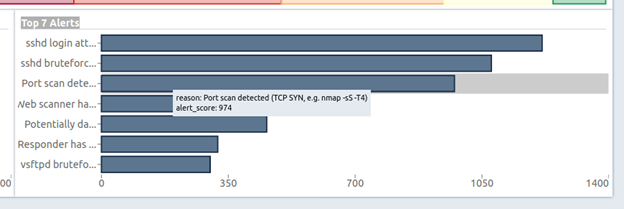
The lower part of the dashboard is reserved for displaying the most active attackers and the most frequent types of alerts for the selected period of time:
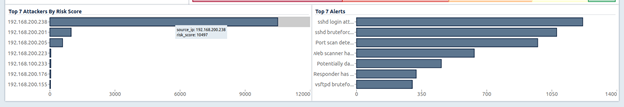
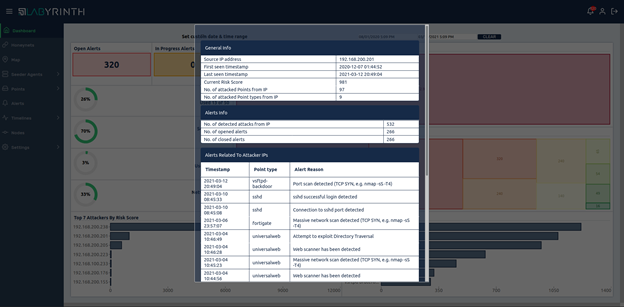
When you click on any of the IP addresses, the profile of the attacker will be displayed with the information collected about him by the system:
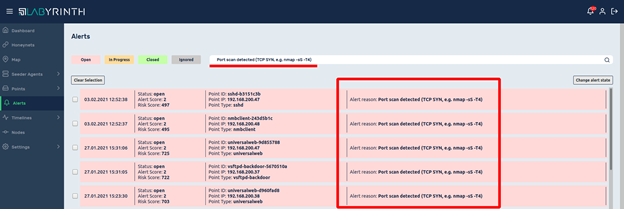
When you click on any of the alert types on the “Top 7 Alerts” dashlet, you will be taken to the list of alerts of this type in the Alerts section. For example, an operator can view all alerts of a given type with detailed information about them by clicking on that type of alert:
Click to go to the list and detailed description of these events:
Starting from this release, it is possible, when integrating with IBM Qradar, to detect the use of account credentials created in Seeder-Tasks file decoys for connecting to any hosts in the Client's network from which SIEM logs are audited:
